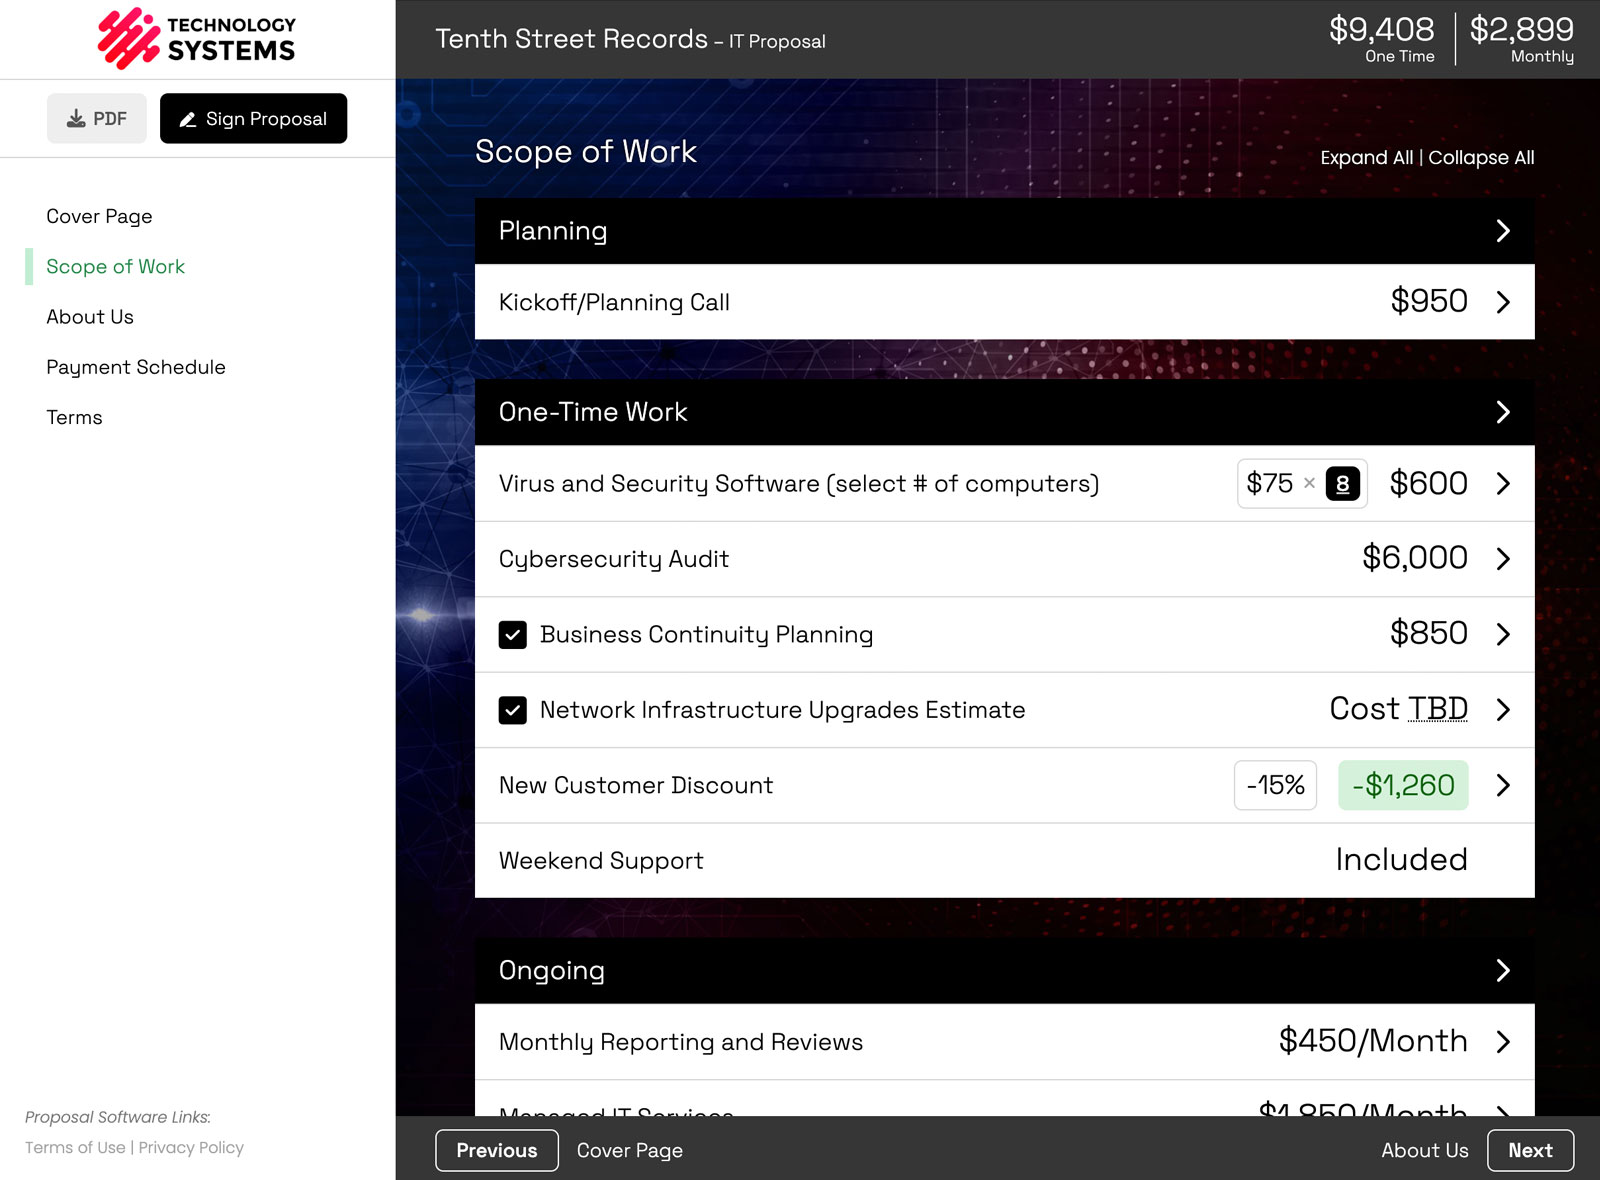
To see your profit margin on a proposal before you send it, turn on the Profit Margins add-on, enter an Internal Cost under Cost on each line item, then open More and choose Profitability. The report shows price, internal cost, profit, and margin. The client never sees any of it.
The reason this post exists: a healthy-looking total can still hide a line you are losing money on, and you usually find that out after the client has already signed.
What Internal Cost is (and what Cost is not)
You have always had a Cost field on a line item. That number is a reference for what you charge. It is not a second ledger of what the work costs you.
Internal Cost is that second number. It sits directly under Cost. Enter what you pay to deliver the work: a subcontractor, hardware you buy, a seat, an hour of your own time. It is not a second price. It does not touch anything a customer sees. It feeds one thing: the Profitability report.
The commercial version of this lives on the Profit Margins feature page. This post is the setup: where the field is, how the report rolls up, and what stays hidden.
How to turn on Profit Margins
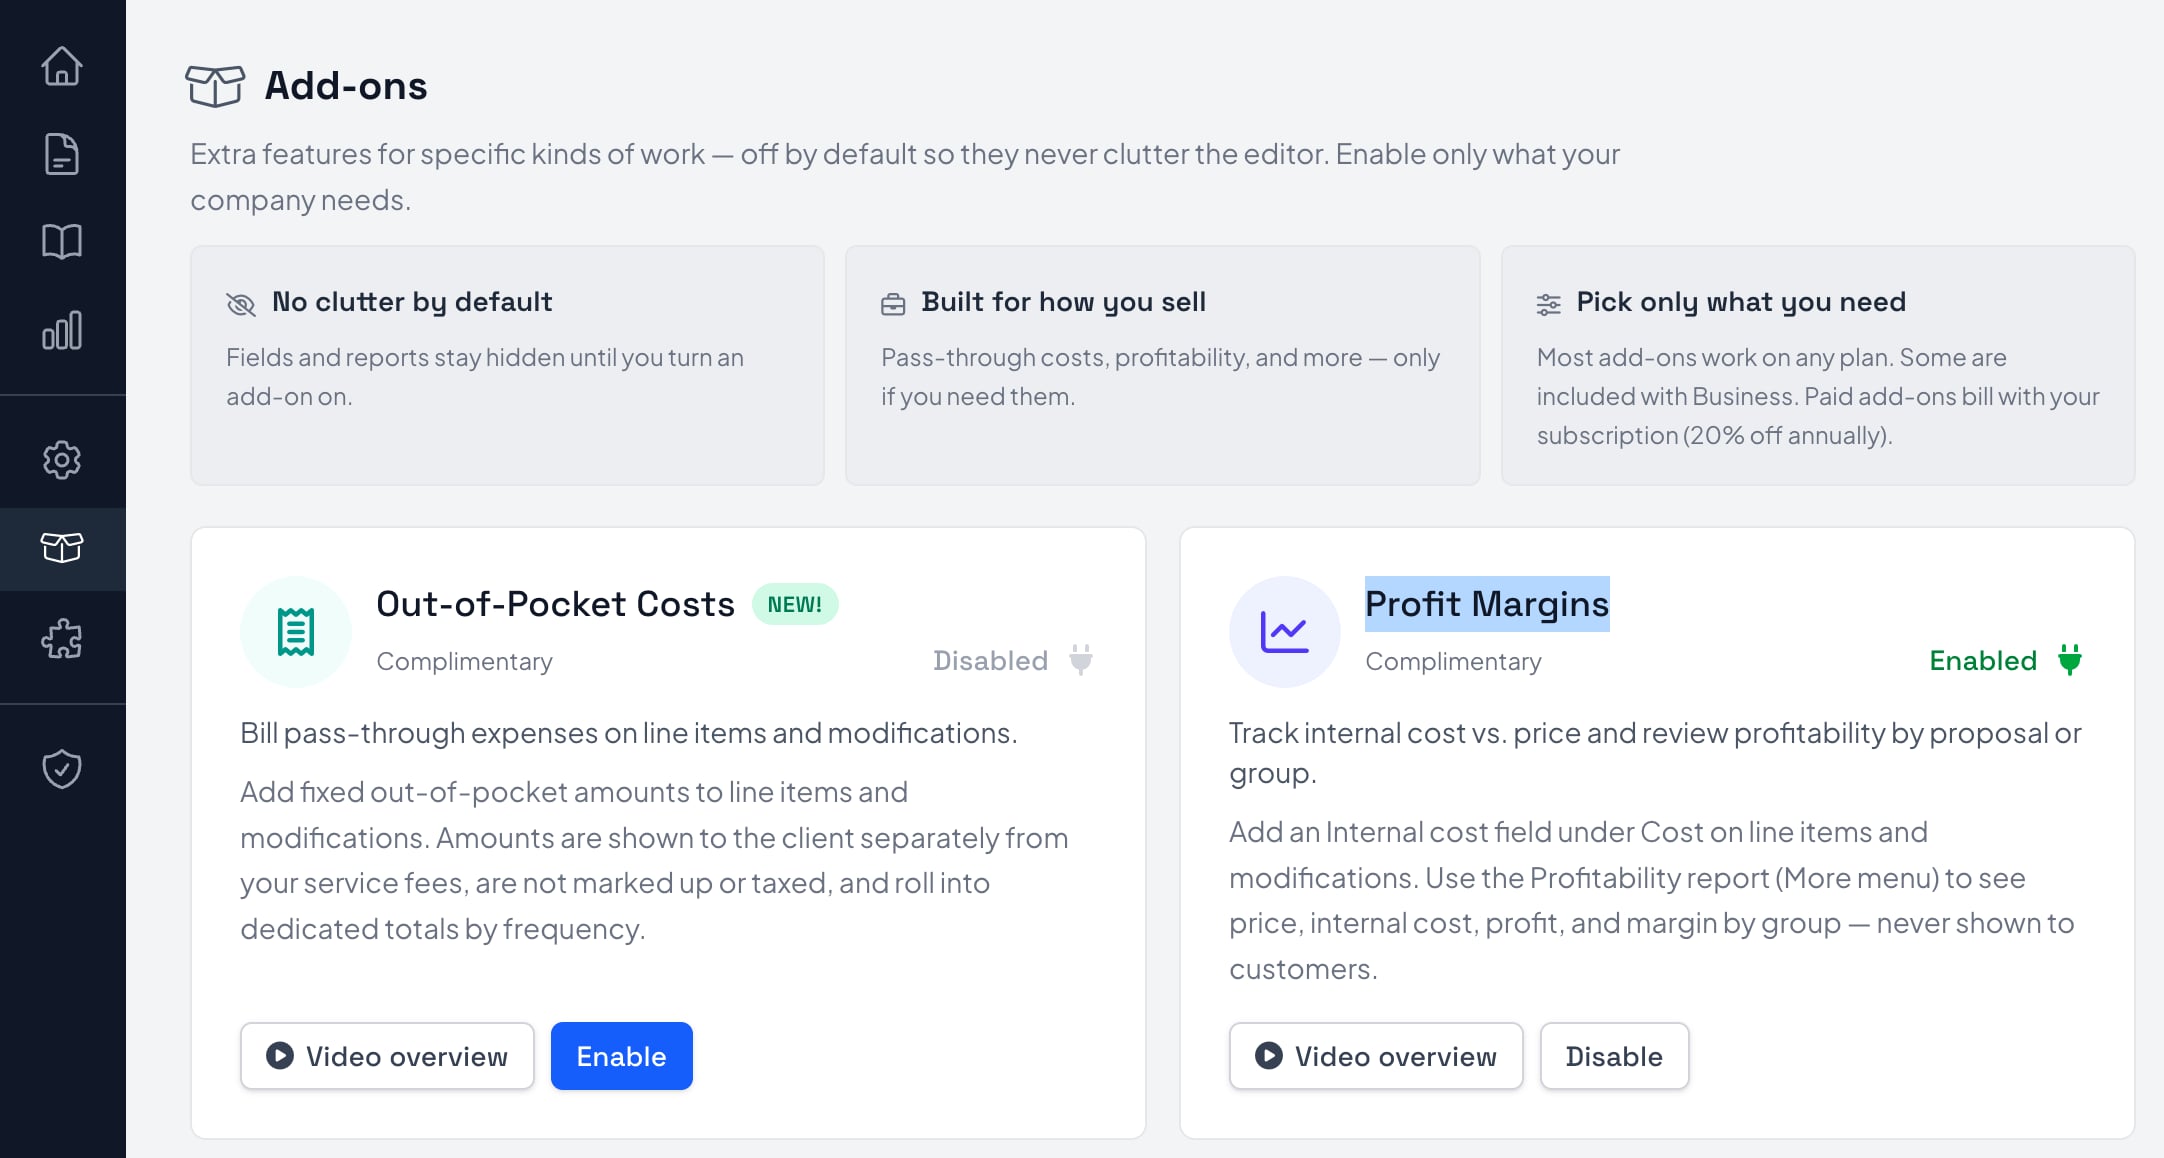
It is a free add-on, off by default. Plenty of accounts never track internal cost, so the field and the report stay out of their editor until someone asks for them.
- Open the Add-ons library at /addons. You need Admin or Owner access.
- Find the Profit Margins card. The label on it is Complimentary.
- Click Enable.
That is the whole setup. An Internal Cost field then appears under Cost on every line item and modification. Existing proposals do not change until you actually enter a number.
Prefer to watch it once? There is a short walkthrough of the field and the report.
How to add an internal cost to a line item
- Click the line item, or its edit pencil, to open Edit Line Item.
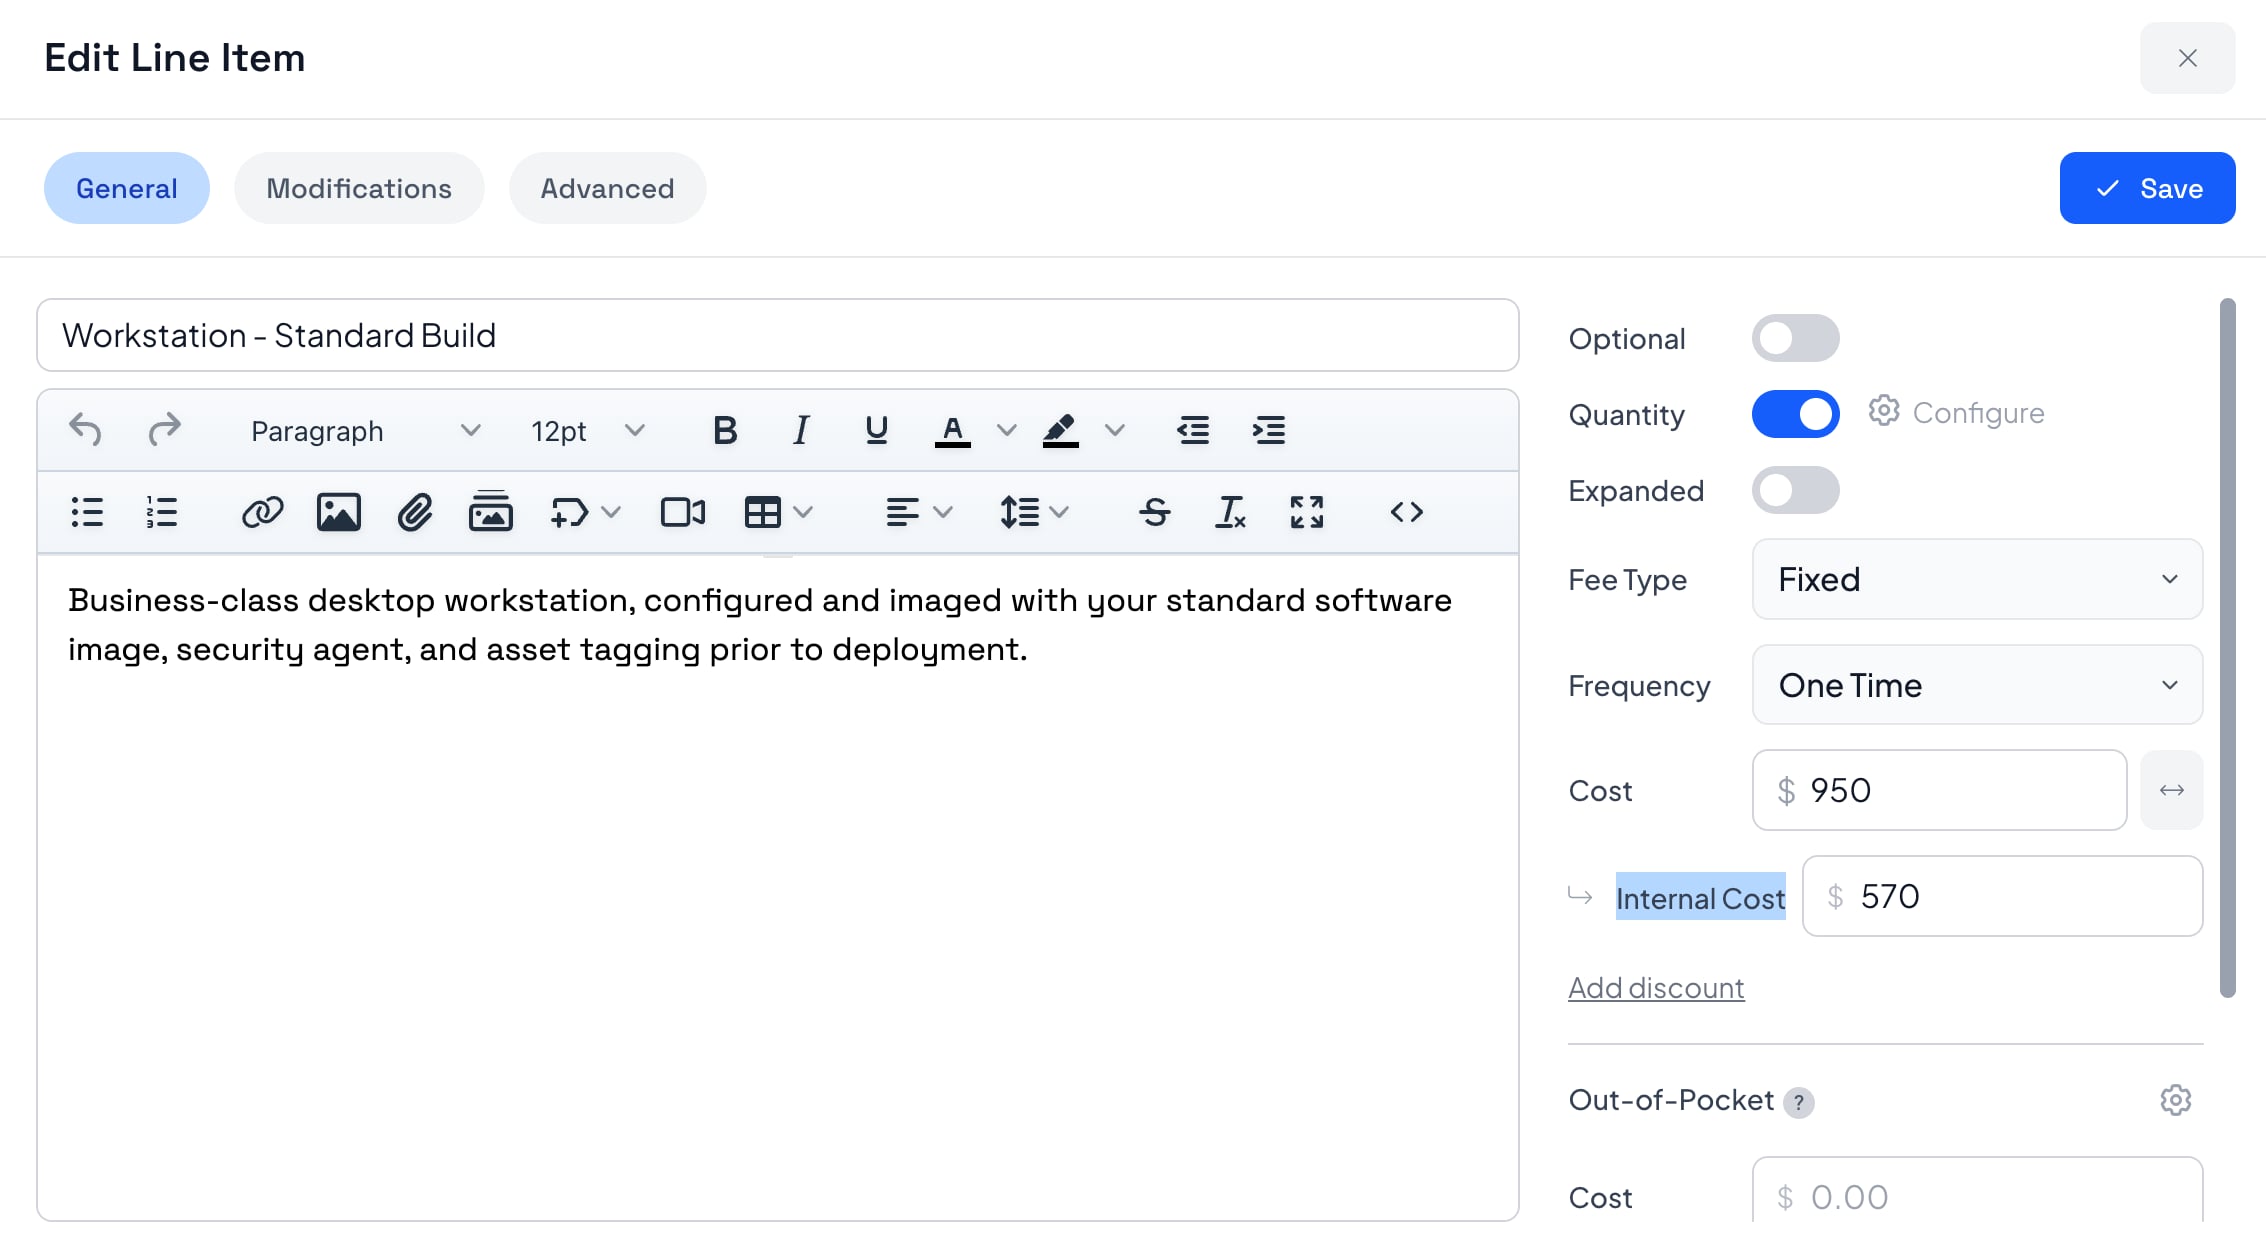
- Stay on the General tab. Internal Cost sits directly under Cost.
- Enter what you pay. If the item has a quantity, enter the cost per unit, the same way you enter the price per unit.
- Click Save.
On a workstation build, that can look like Cost $950 and Internal Cost $570. The client still sees $950. You now have the other number sitting underneath it.
Is Internal Cost per unit, or for the whole line?
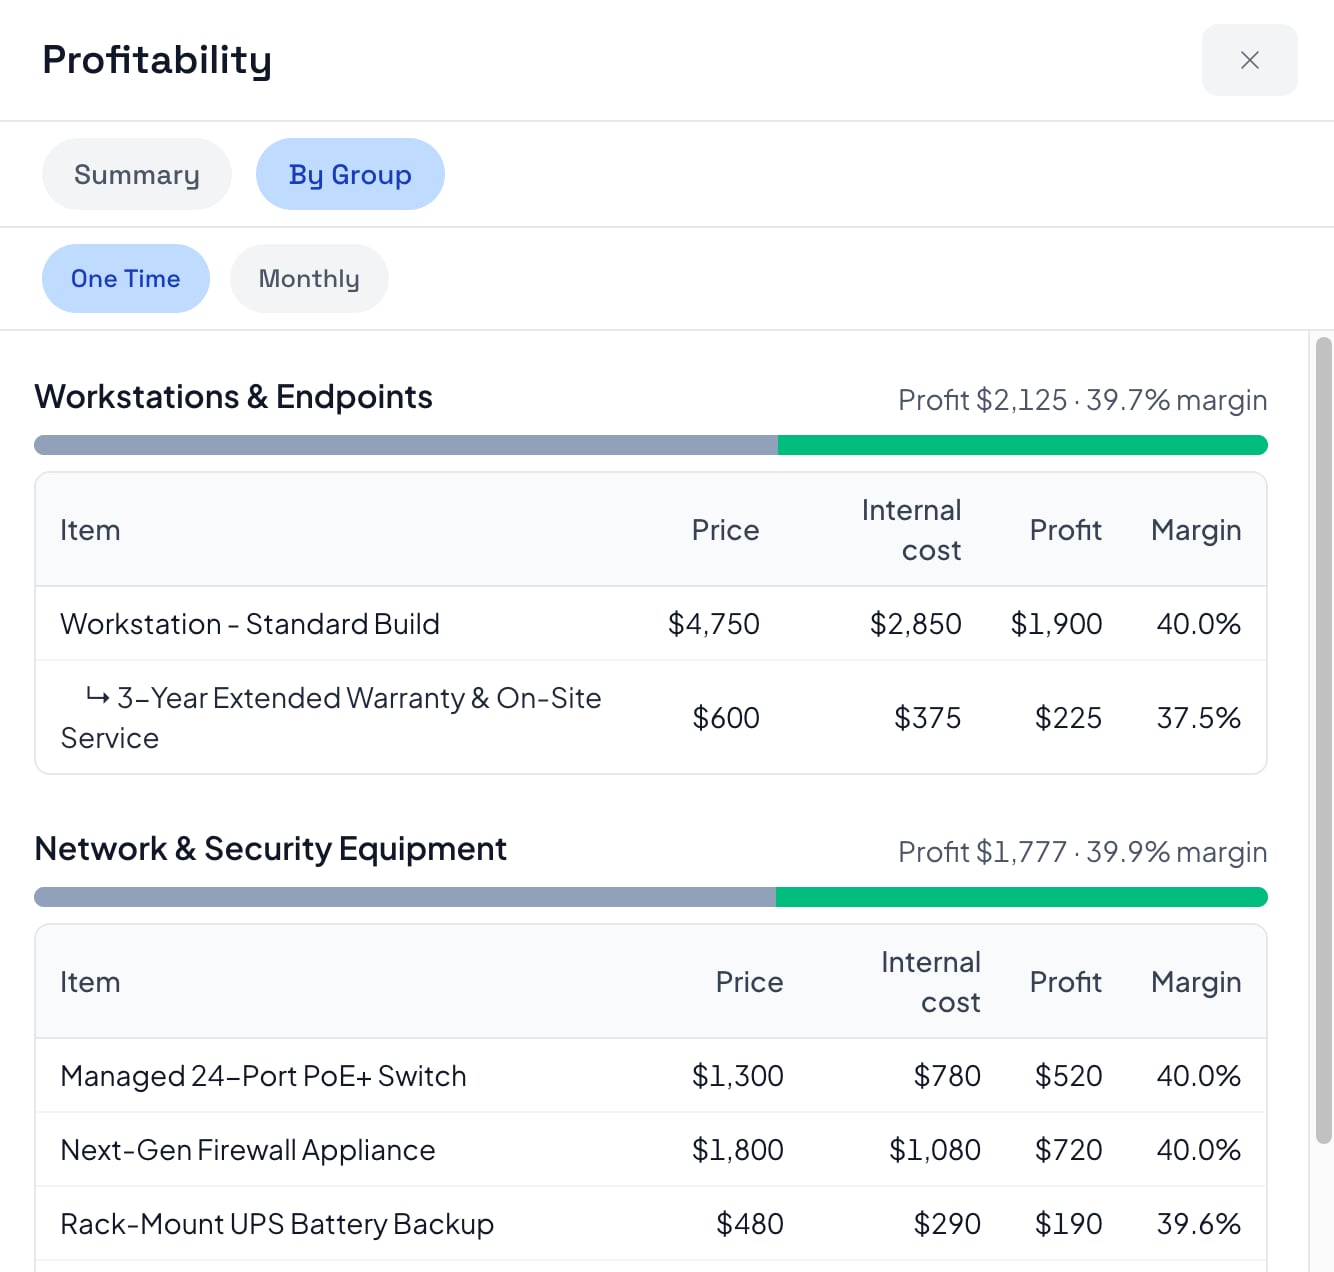
Per unit, when quantity applies. The screenshot above is a Workstation - Standard Build at $950 each, with an internal cost of $570 each. Quantity is 5, so the Profitability report rolls that up to a $4,750 price, a $2,850 internal cost, $1,900 profit, and a 40.0% margin.
Same math on a modification. A 3-year extended warranty at $600 with a $375 internal cost shows $225 profit at 37.5%. The warranty follows the workstation it is attached to.
Hourly line items work the same way on the cost side. The price side uses the proposal's own hourly-task rates. You put your internal hourly cost in the Internal Cost field and the report lines the two up.
How to open the Profitability report
In the proposal editor, open the More menu in the black top bar and choose Profitability. There is also an icon-only chart button in that same bar, which is the one you want during a screen share. Both open the same view.
The report is an internal view for your team. It is not available on Library items, and it is not available on proposals already marked Won or Lost.
What the Summary view shows
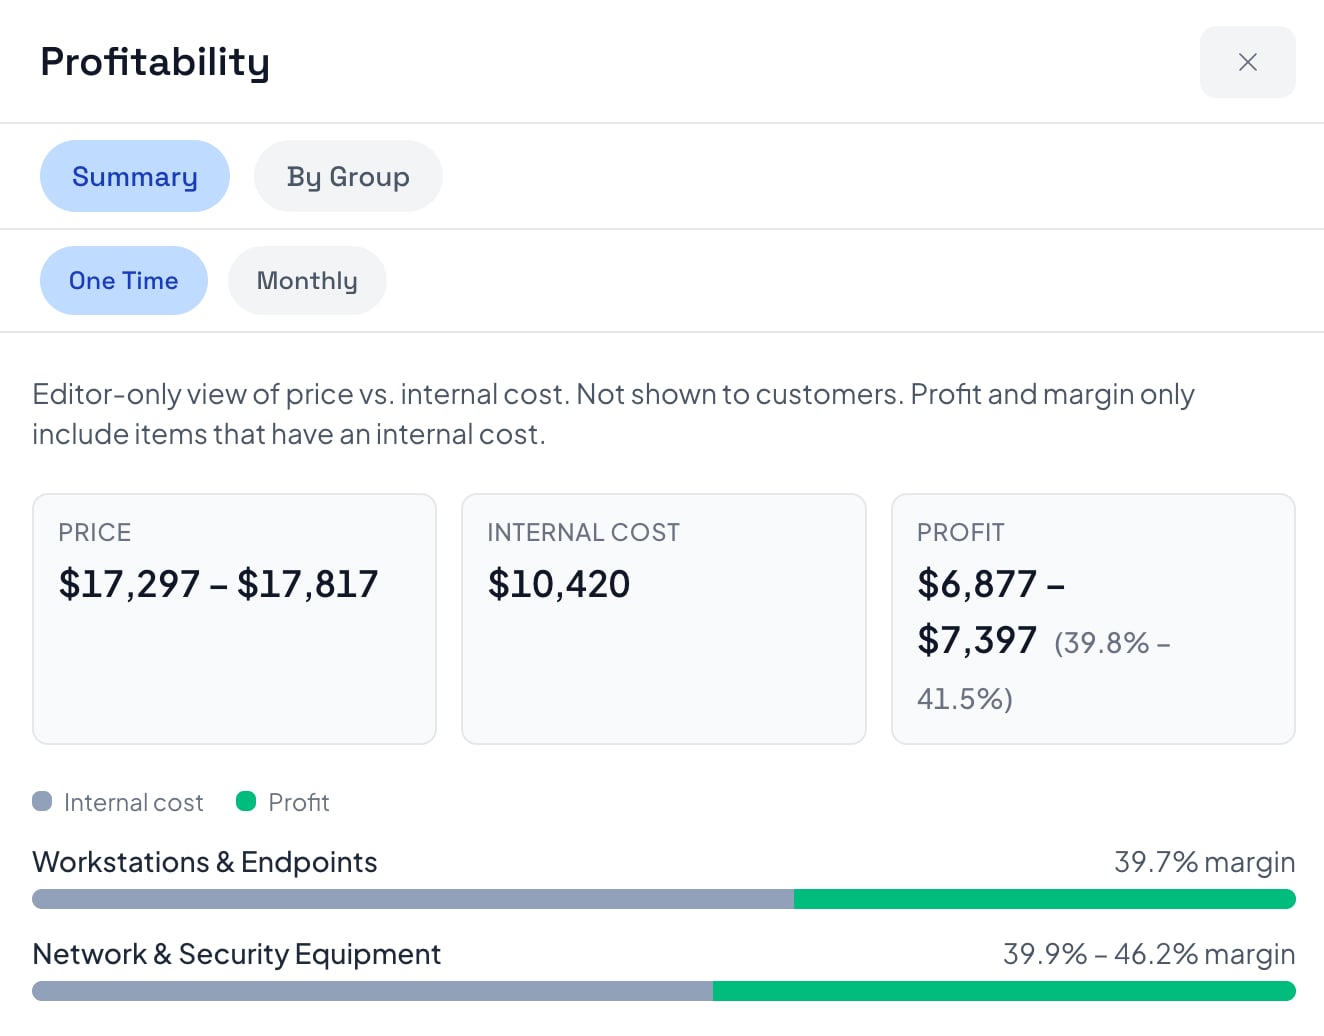
Four numbers for the whole proposal: total price, total internal cost, total profit, and overall margin. Profit is price minus internal cost. Margin is that profit as a percentage of the price.
On the hardware proposal in the screenshot, Summary shows a price of $17,297 to $17,817 (a range, because some items use a price range), an internal cost of $10,420, and profit of $6,877 to $7,397 at a 39.8% to 41.5% margin. Group bars sit underneath: Workstations & Endpoints at 39.7%, Network & Security Equipment at 39.9% to 46.2%.
How to read the report by group
Click By Group. You get the same four columns (Price, Internal cost, Profit, Margin) for every item, rolled up per group, so you can see which part of the scope is carrying the deal.
Workstations & Endpoints in this example: $2,125 profit at 39.7%. Network & Security Equipment: $1,777 profit at 39.9%. The workstation build is 40.0%. The warranty under it is 37.5%. A Next-Gen Firewall Appliance at $1,800 / $1,080 shows $720 profit at 40.0%. If one of those were underwater, this is where you would catch it, while you can still change the price.
What if the proposal has one-time and monthly fees?
They stay separate. A second row of tabs (One Time, Monthly, and so on) filters both views, so a setup fee is never added to a retainer. If everything on the proposal is one frequency, that row does not appear.
Does the client see my internal cost or margin?
No. Internal cost is stripped out of the proposal data recipients receive. It is not on the page, not in the totals, and not available as a variable or token. There is no way to accidentally publish it.
That is also why the chart button in the black bar is icon-only. If you are walking a client through an interactive pricing table on a screen share, you can still open the report without a label that says "Profitability" sitting in the chrome.
How this is different from out-of-pocket expenses
These two get confused constantly, so to be exact:
- Internal cost is what you pay to deliver the work. The client never sees it.
- Out-of-pocket is what the client pays on top of your fee, like ad spend or a license. It is meant to be visible.
Both can sit on the same item at the same time. The client sees your fee and the pass-through cost. You see the margin underneath it. If you want the client-facing side, that lives in Out-of-Pocket Expenses, and the how-to is in Show Ad Spend Separately From Your Management Fee.
Why this is an add-on, not a core feature
Because a field that a slice of accounts need should not sit in the editor for everyone else. Features everyone touches go into the core product. Specialized ones become add-ons you switch on when you need them. Profit Margins is free. It is just off until you turn it on.
Turn it off later and nothing you entered is deleted. Templates and Library items hide the Internal Cost field right away while keeping the stored amounts. Live proposals that already have internal costs keep both the field and the Profitability report. If you pull a Library item into a proposal while the add-on is off, the copy comes in without those fields. Duplicating an item inside the same proposal keeps them.
Agencies tend to turn this on for the work they subcontract. IT and MSP shops tend to turn it on for hardware and managed services, so a 40% hardware margin and a thinner warranty do not get averaged into one comforting number.
Smart Pricing Table is interactive proposal software with live pricing tables for agencies, IT companies, and consultants.
or start a free trial and try it yourself.
Explore more
Internal cost the client never sees
Pass-through costs, split from your fee
Live totals clients can adjust
Frequently Asked Questions
Where is the Internal Cost field in Smart Pricing Table?
Open the line item, or click its edit pencil, to reach Edit Line Item. On the General tab, Internal Cost sits directly under the regular Cost field. The same field appears on modifications. It only shows up after an Admin or Owner turns on the Profit Margins add-on.
How do I turn on the Profit Margins add-on?
Open the Add-ons library at /addons as an Admin or Owner, find the Profit Margins card, and click Enable. It is free. The Internal Cost field and the Profitability report then appear for everyone building proposals in the account.
What happens if I have not entered any internal costs?
The report does not invent a wall of $0 margins. Profit and margin only count items where you actually entered an internal cost. If you have not entered any, the report says so. Skip a line on purpose and it will not drag the overall percentage down.
Is Internal Cost entered per unit or for the whole line item?
Per unit, when quantity applies, the same way you enter the price per unit. A workstation at $950 with a $570 internal cost and a quantity of 5 rolls up to $4,750 / $2,850 / $1,900 profit at a 40.0% margin in the report.
How do I open the Profitability report?
In the proposal editor, open the More menu in the black top bar and choose Profitability, or click the icon-only chart button in that same bar. The report is not available on Library items or on proposals already marked Won or Lost.
What happens if I turn the Profit Margins add-on off?
Nothing you entered is deleted. Templates and Library items hide the Internal Cost field while keeping the stored amounts. Live proposals that already have internal costs keep both the field and the report. A Library item pulled into a proposal while the add-on is off comes in without those fields. Duplicating an item inside the same proposal keeps them.
You might also like:
👉 Show Ad Spend Separately From Your Management Fee
👉 Stop Typing the Proposal Total Into Your Terms by Hand
👉 3 New Features: Volume Pricing, Email Templates, Custom Variables